How to Read Trading Charts in 2026| A Forex Beginner’s Guide
As for as online trading is concerned, most beginners feel confused about learning how to read trading charts. All lines, candles, and numbers on the charts create confusion. Do you feel so? If yes, then you are not alone.
Reading Trading Charts in 2026
In fact, there is no one who can become expert trader from the day one because every successful trader also started at a forex trading chart without any prior knowledge. Consequently, they become masters and expert forex traders because of continuous learning. To start learning, you just need consistency, discipline and patience in trading. As compare to past, reading charts is now easy for beginners. Here at Enlightrs, our purpose is to provide a beginner-friendly guide which can break down every key element, forex chart types to forex timeframes, in simple and easy steps. Whether you are just planning to start trading or looking to sharpen your skills, this article can give you a solid foundation. If you are also new to trading in general, start with our complete guide on how to start forex trading before diving into charts.
What Is a Forex Trading Chart?
A forex trading chart is actually an interface which contains visual graph to show how the price of a currency pair moves over time. This graph not only contains the price figures but also tells the story of buyers and sellers when you read the chart. Understanding how to read a trading chart is the first skill every trader must master before planning a single trade. Without it, you are essentially trading blind. For this purpose, forex trading terminology can help you interpret the chart as a professional trader.
What Does a Forex Chart Actually Show You?
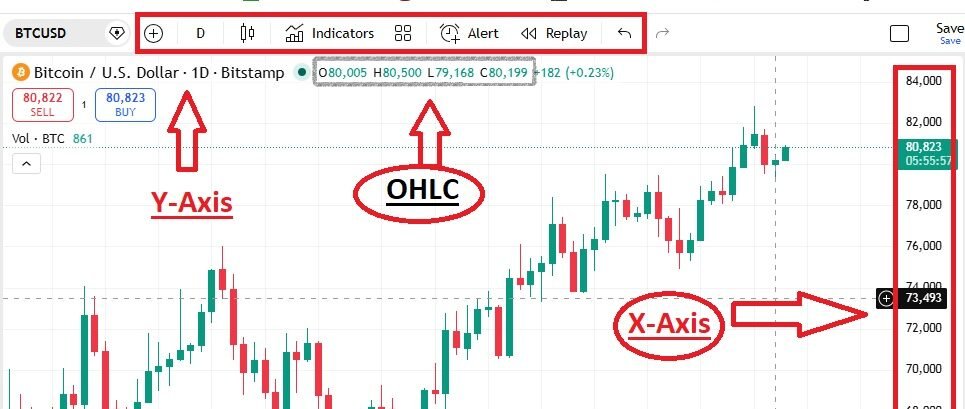
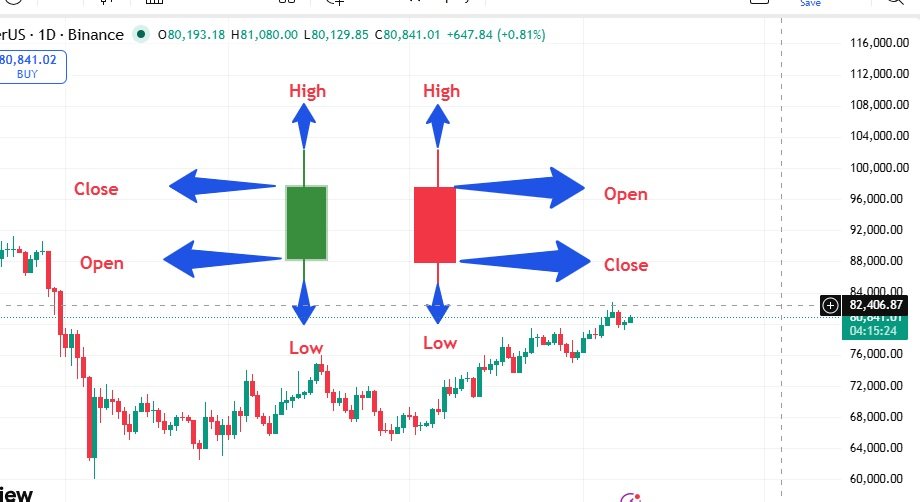
A trading chart has two axis: X-axis and Y-axis. At its core, x axis of trading chart shows you time of the trading pair, and Y-axis helps you find price of relevant currency pair. Apart from its appearance, every point on the chart represents a price at a specific moment. Furthermore, most charts display forex OHLC data which stands for Open, High, Low, and Close. In fact, these four values give you a complete picture of what happened during any chosen time period.
| OHLC Letter | Stands For | What It Means on the Chart |
| O | Open | Price at the start of the time period |
| H | High | Highest price reached during the period |
| L | Low | Lowest price reached during the period |
| C | Close | Price at the end of the time period |
For example, let’s look at daily BTC/USD chart. When you click a candle, whether green candle or red candle, some information will popup on the x-axis of the chart. As you can see in the image below. This image will help you know how to read trading chart. Each data point tells you the opening price of the day, the highest price of the day, the lowest price dropped to, and the daily closing price.
Types of Online Trading Charts
Every trading chart cannot be helpful to understand or to start trading. Therefore, it is mandatory for you to know which type of chart you are looking at. There are three main forex chart types that every beginner should understand. Each one shows the same price data in a different visual format. Choosing the right one depends on how much detail you need.
Line Chart in Online Trading
How to Read Line Charts in Online Trading?
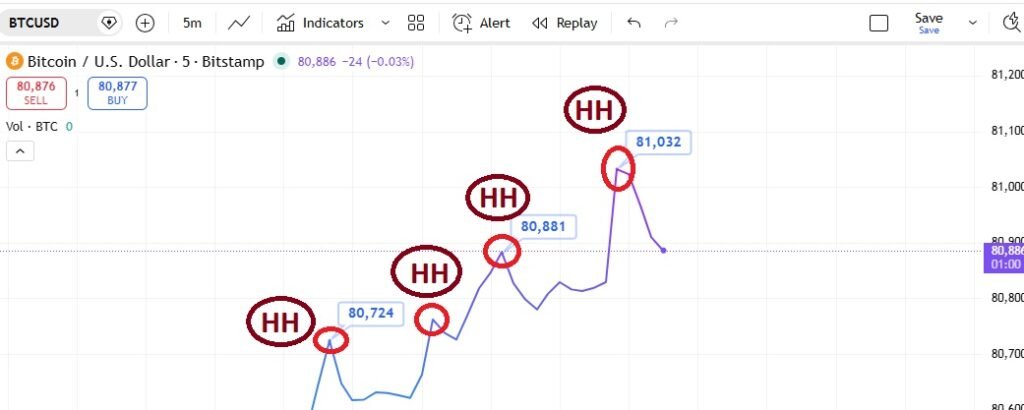
In line chart, you see an up & down moving line. At first, it looks difficult to understand what is going on. In fact, the line chart is the simplest way to read a trading chart in forex. It just shows a running price of selected pair. Furthermore, you can see the closing price in the line with the help of a node. Here you can guess the last price of the currency pair on the chart. It connects closing prices with a single line, showing you the general direction of price over time. However, it does not show you the full OHLC data, so it lacks detail for making precise trade entries.
Example: If BTC/USD closes at 80724, 80881, and 81032 on three different intervals of M5 chart, the line chart draws a smooth upward line, clearly showing a rising trend with the help of a continuous pattern of Higher Highs (HH) .
Bar Charts in Online Trading
How to Read Forex Bar Charts
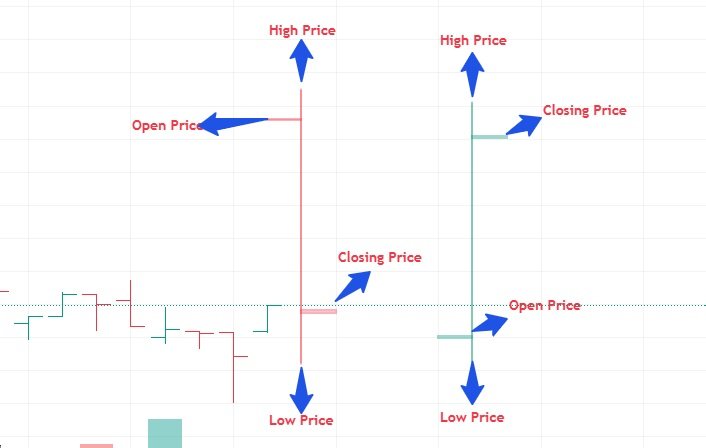
A bar chart gives you far more information than a line chart. Each vertical bar represents one time period and shows the Open, High, Low, and Close prices. This is why bar charts are also called OHLC charts. The left horizontal tick on the bar marks the opening price, and the right tick marks the closing price. Additionally, the top of the bar shows the highest price, while the bottom shows the lowest.
Example: On an H4 bar chart, a tall bar with a high top and low bottom tells you that price moved a lot during those 4 hours — showing high market volatility.
Candlesticks Forex
How to Read Trading Chart?
Many expert traders prefer candlesticks charts because these charts have a clear picture of trading market by displaying the same OHLC data as bar charts. In fact, it has more visuals than any other chart, and it is also easy-to-read for every trader whether they are beginners or professional traders. A candle with buyers have green color while the candle shows red color to represent sellers in the market. Each candle has a body (showing open to close) and wicks (showing high and low). This color-coding makes how to read a chart much faster and more intuitive for beginners.
4 Key Elements to Learn How to Read On While Reading Charts
After getting a lot of information about chart types, let’s move on towards the deeper analysis of a chart. The advance level of understanding the way to read forex charts beyond just looking at them lies in four key elements: timeframes, highs and lows, support and resistance, and price action. Master these four elements, and you will become an expert to do an analysis of how market starts.
Understanding Forex Timeframes: Which One to Use
Actually a trading timeframe tells you about how much time each candle or bar on the chart represents. For example, on a one minute (M1) timeframe chart , each candle covers one minute of trading. In the same way, each candle covers one hour trading time on an hour (H1) timeframe chart. So, choosing the right timeframe depends on your trading style. Here is a simple breakdown.
| Timeframe | Code | Best Use Case | Trader Type |
| 1 Minute | M1 | Very short-term scalping | Scalping |
| 1 Hour | H1 | Intraday trading | Day Trader |
| 4 Hours | H4 | Swing trading setups | Swing Trader |
| Daily | D1 | Long-term trend analysis | Position Trader |
As a beginner, avoid starting with M1 or M5, these are the most chaotic, noise-filled timeframes. Start with H4 or Daily charts instead, which show clearer trends and give you more time to think before entering a trade.
How to Read Trading Charts in 2026 on Different Platforms
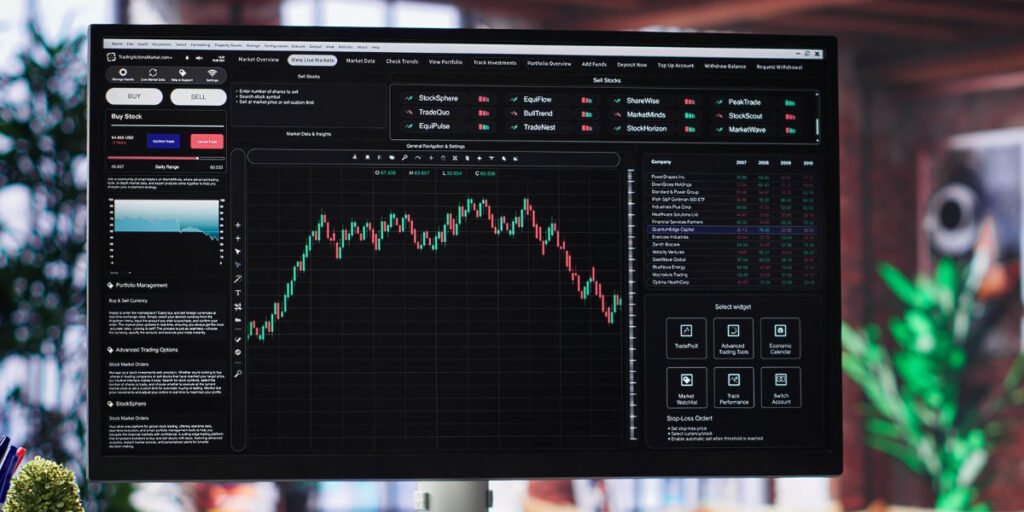
Only learning about the chart reading is not enough for you. To become a profitable trader, it is also essential for you to know how to actually use a trading platform. There are many more ways and platforms to execute a trade, but the two most common ways for beginners MetaTrader 4 and mobile trading apps (brokers). For instance, trading view, Exness, Xmglobal and meta trader 5. Each mobile app and desktop trading website give full access to forex trading charts; however, the trading setup process differs slightly.
How to Read Forex Charts on MetaTrader 4?
This trading platform has some of advanced versions of forex trading charts. Its latest version is MT5 while MetaTrader 4 (MT4) is the most widely used desktop trading platform in the world. Here is how to set up a clear chart on MT4 for the first time:
- Open MT4 and log in to your demo or live account.
- At first, Click Insert option , then move towards the Charts tab to open a new chart window for your chosen currency pair.
- Now, you can adjust colors and candle styles according to your ease. For this purpose, right-click the chart and select “Properties” and reset the chart settings.
- Now, the important thing is the time frame. You may select your timeframe from the toolbar at the top.
- Additionally, you can add indicators if needed by clicking “Insert” and move towards “Indicators option”.
How to Read Forex Charts on Your Mobile Phone in 2026
In the world of advanced technology, it is mandatory to learn how to read forex charts on mobile phone in 2026. It actually helps you to monitor your trades every moment. Furthermore, you may follow the given tips for reading charts on your phone clearly:
- Download MT4 or MT5 from your app store. Both apps are free and fully functional on Android and iOS.
- You can follow the same steps on mobile phone as on desktops to read any timeframe chart.
- You can zoom in the chart by using two fingers to expand the chart, and it will help you see the candles on trading chart more clearly.
- Use a few number of indicators on mobile so that a clear chart with just price action should be visible for better understanding.
Online Trading Mistakes for Beginners
Online trading is a continuous process of learning. There are some mistakes which can cost you. If you start avoiding these three errors, you can save yourself from a lot of frustration early on. Here is the complete list of online trading mistakes for beginners:
- Ignoring the market trend on the selected currency pair.
- Ignoring the timeframe of the chart and start executing trades blindly.
- Using too many indicators and creating a cluttered, unreadable chart.
- Ignoring the higher low prices of the currency pairs on the chart.
- Switching timeframes randomly without a clear reason, which leads to confusion and bad trade entries.
Conclusion
At the end of this discussion, now, you have every important piece of information and knowledge about reading online trading charts. You just need to start learning how to read trading charts in 2026 with confidence. Every key element is the building blocks for every successful trader’s skill set. Now, it is time to step in. Just open a free demo account and practice reading charts daily. Your every attempt to study the forex trading graph brings you one step closer to consistent, confident trading. Start learning today!
Frequently Asked Questions
To read forex charts as a beginner, start by identifying the chart type — line, bar, or candlestick. Then check the timeframe. Next, look for the overall trend direction using highs and lows. Finally, identify key forex support resistance levels. Practice on a demo account daily until chart reading feels natural and automatic.
The line chart is the easiest to read a chart for complete beginners because it simply shows a line connecting closing prices. However, most traders quickly move to candlestick charts because candlesticks forex provide much more useful information — including open, high, low, and close — while still being visually easy to understand
To read forex charts on mobile phone, download the MetaTrader 4 or 5 app, open your chosen currency pair chart, and set the timeframe to H4 or Daily for the clearest view. Keep your chart setup simple — avoid adding too many indicators on a small screen. Use pinch-to-zoom to expand candles and read price levels more accurately
A higher low chart pattern occurs when each successive price dip ends at a higher level than the previous one. For example, if EUR/USD pulls back to 1.0900, then to 1.0930, then to 1.0960 — each low is higher than the last. This is a strong signal that buyers are gaining control and that an uptrend is forming or continuing. It is one of the most important patterns to spot when reading charts in forex.